










Your analyst team loses 7–8 hours a day to manual data collection. IMIP gives that time back to analysis.
9 modules, each fed by real government and market data — UN Comtrade trade flows, World Bank & IATI project pipelines, NSE live quotes, LME benchmarks, Ministry of Steel circulars. Updated continuously through the day, not once in the morning, so your team spends its time deciding, not copying numbers into spreadsheets.
No credit card — instant access to the live platform in demo mode.

A Familiar Morning
Before the team finishes its first coffee, it has already collectively spent 2–3 hours just collecting data, split across whoever owns each source below.
Total: ~7–8 hours of data collection across the team, every day — before any analysis begins.
Same Data. 95% Less Time.
reclaimed per month, for a team of 5 analysts
Estimated based on typical analyst workflow at a mid-size Indian steel company, split across a small team rather than done by one person. Actual savings depend on team size and data scope.
Three Roles. One Dashboard. Zero Manual Data Collection.

Senior Leadership
CEO · CFO · VP Strategy
You sit through briefings on data that should have been on your screen before the meeting started.
Full market brief — prices, margins, trade flows, project pipeline — in under 2 minutes. Go from “let me check” to “here are the numbers” in any board discussion.
See the Dashboard
Commercial Analyst & Trader
Market Intelligence · Procurement
Half your day goes to collecting the same data points you collected yesterday.
One unified view of HRC, coking coal, scrap, and flat product prices — trend and history included, processed through IMIP's own engine. The collection part is done. Spend the time on analysis.
See Prices & Trade
BD & Strategy Manager
Business Development · Strategic Planning
You find out about infrastructure projects when the tenders are already floated.
Set a state-level alert — say, Rajasthan steel infrastructure. Get notified when a project enters the pipeline. See demand signals 60–90 days before real orders arrive.
See the Map & ProjectsNot sure which view fits your role? Tell us what you do — we'll walk you through the dashboard for it.
Request a walkthrough
Every Hour of Delay Is a Decision Made Slower Than Your Competitor
Three decisions that come up every week in India's steel sector. How fast they get made depends entirely on when the data arrives.
Import or Domestic — Right Now
Your procurement manager has an import offer on the table. The decision hinges on today's FOB China price and the India landed cost — data that currently arrives by end of day, after a broker call.
IMIP shows FOB China assessment, import freight benchmarks, and current domestic HRC premium — side by side, always current. The decision gets made in the room, not after it.
Procurement speedKorea vs. China — Who Gets the Order
Your supply chain team is comparing coking coal sources. Price, quality, and active import volumes from Korea versus China all factor in — and the data lives in three different places.
The Trade tab shows active import flows by origin country, price benchmarks, and market share trends across recent months. No calls needed. Compare, decide, confirm.
Trade intelligenceWhere to Invest Distribution Next
You're evaluating which states to prioritize for distribution or stockyard investment. Infrastructure pipeline, demand concentration, and competitor footprint all matter — and none of it is in one place.
The Map module overlays project pipeline, state-level demand heatmap, and known competitor facilities. You see the opportunity and the risk before committing capital.
Strategic market entry
Nine Modules. One Dashboard. All Real Data.
Each module replaces a data problem your team solves manually today — powered by real government and market feeds (UN Comtrade, World Bank, IATI, NSE, LME), updating on its own instead of waiting for someone to refresh a spreadsheet.
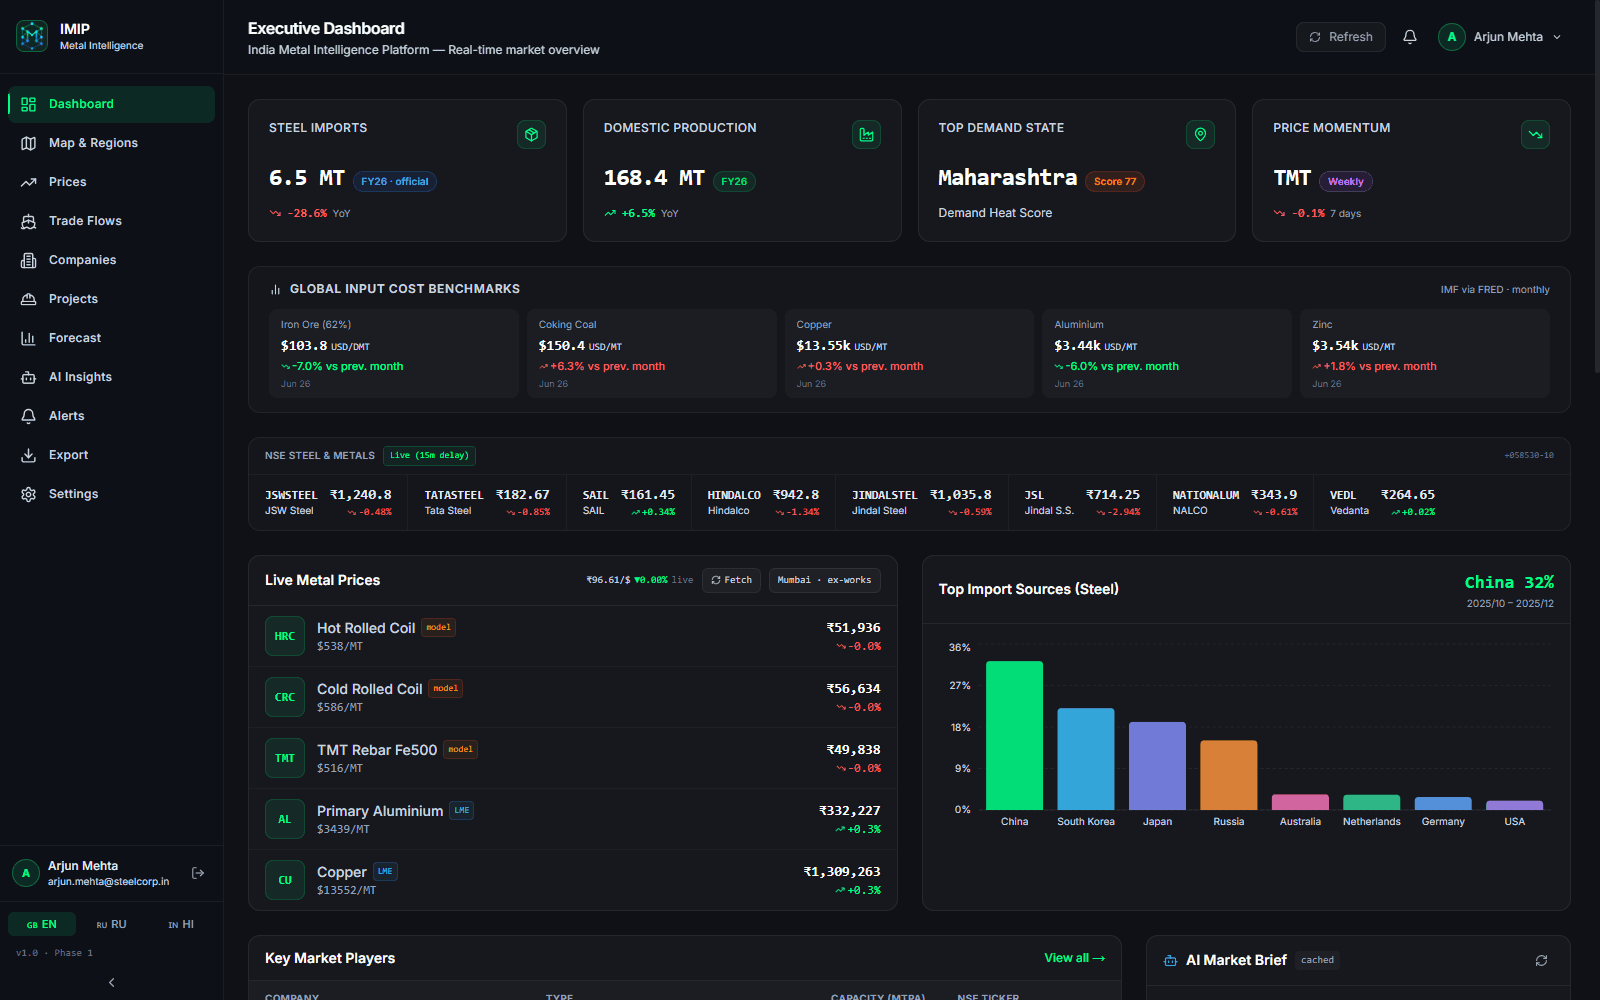
Dashboard
Full market state in 60 seconds — before your board meeting
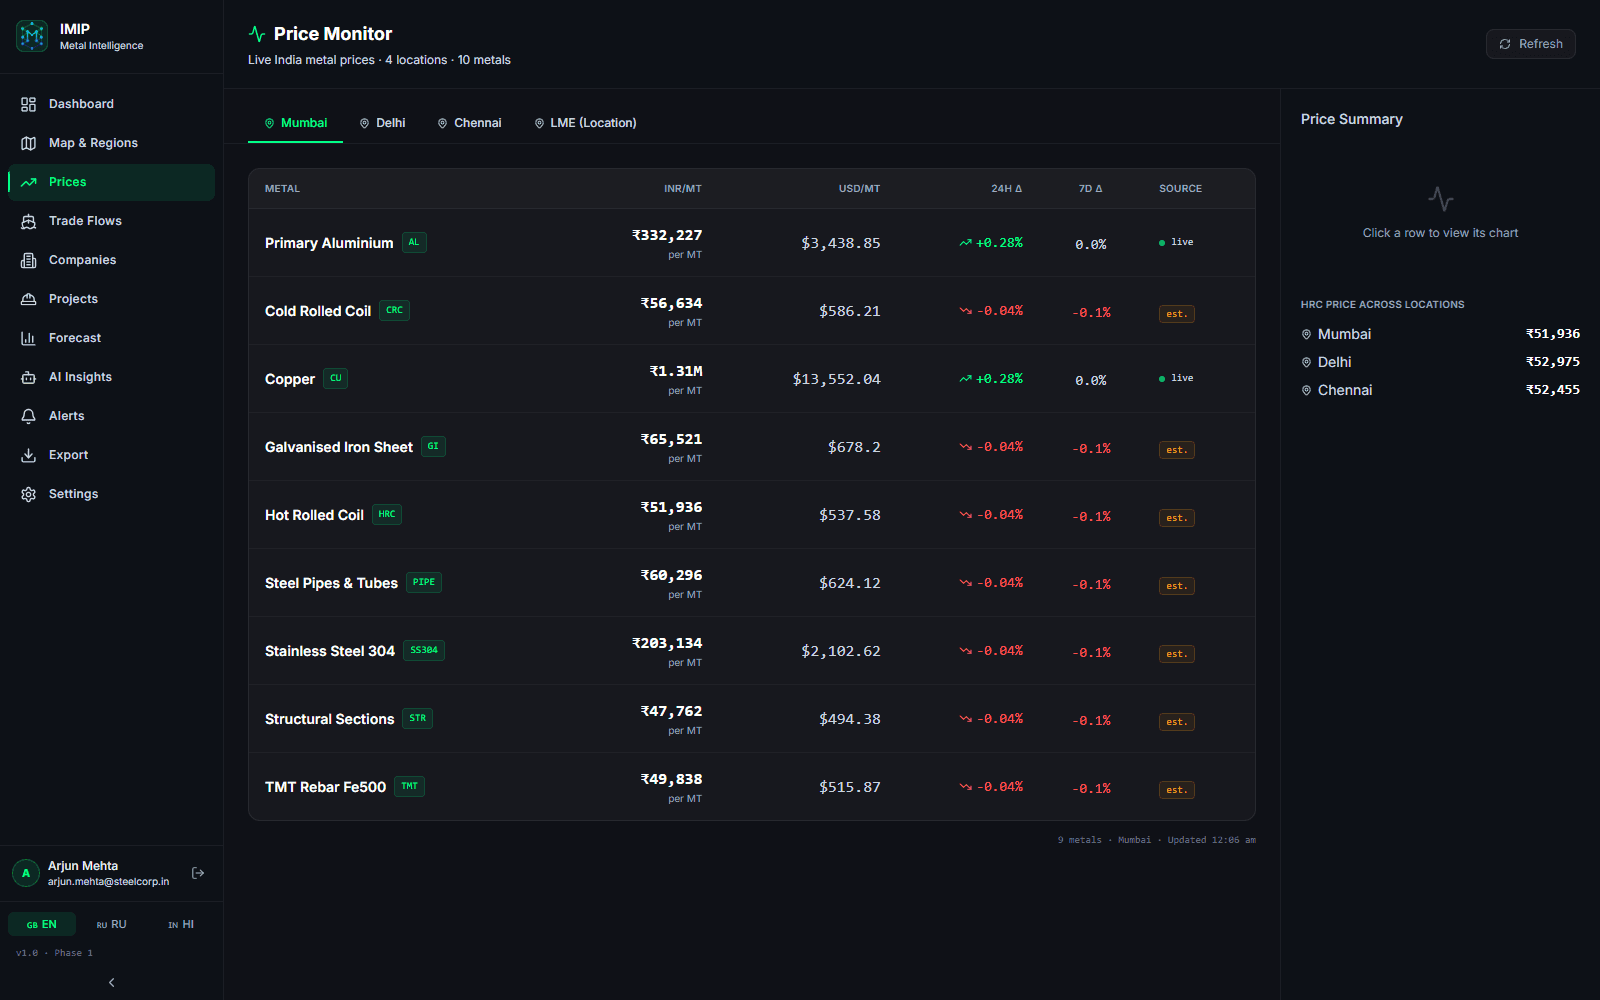
Prices
Price + source + date. No more “roughly around ₹50,000”
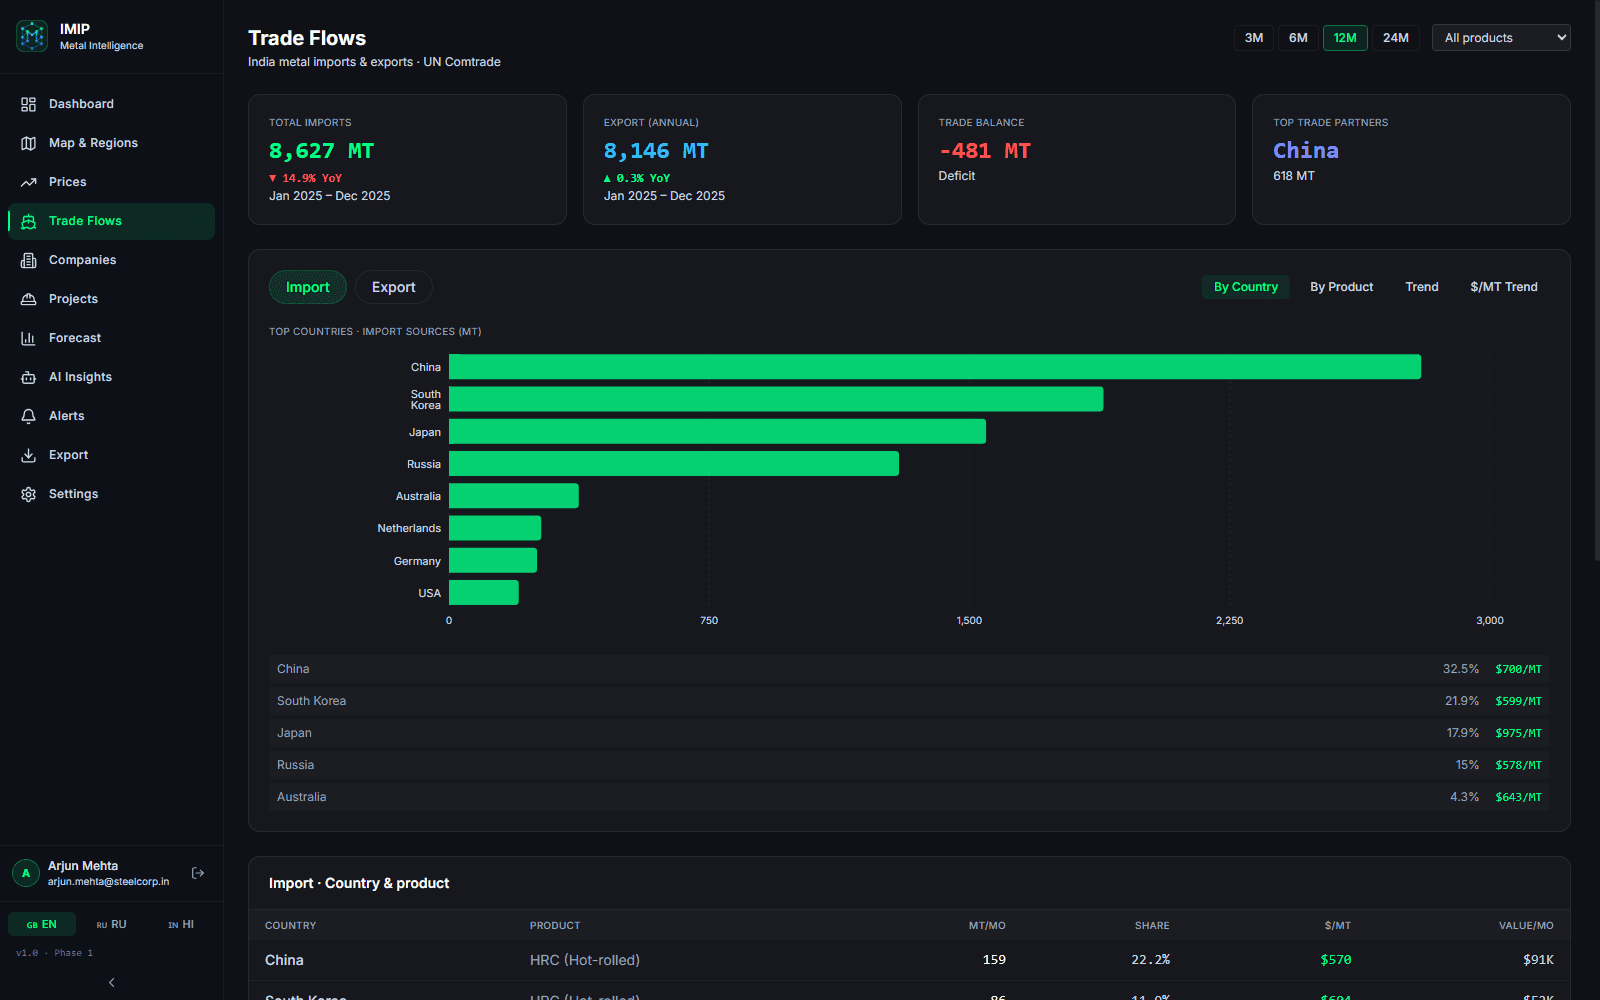
Trade
See who's taking market share — China, Korea, Japan — real UN Comtrade flows, not instincts
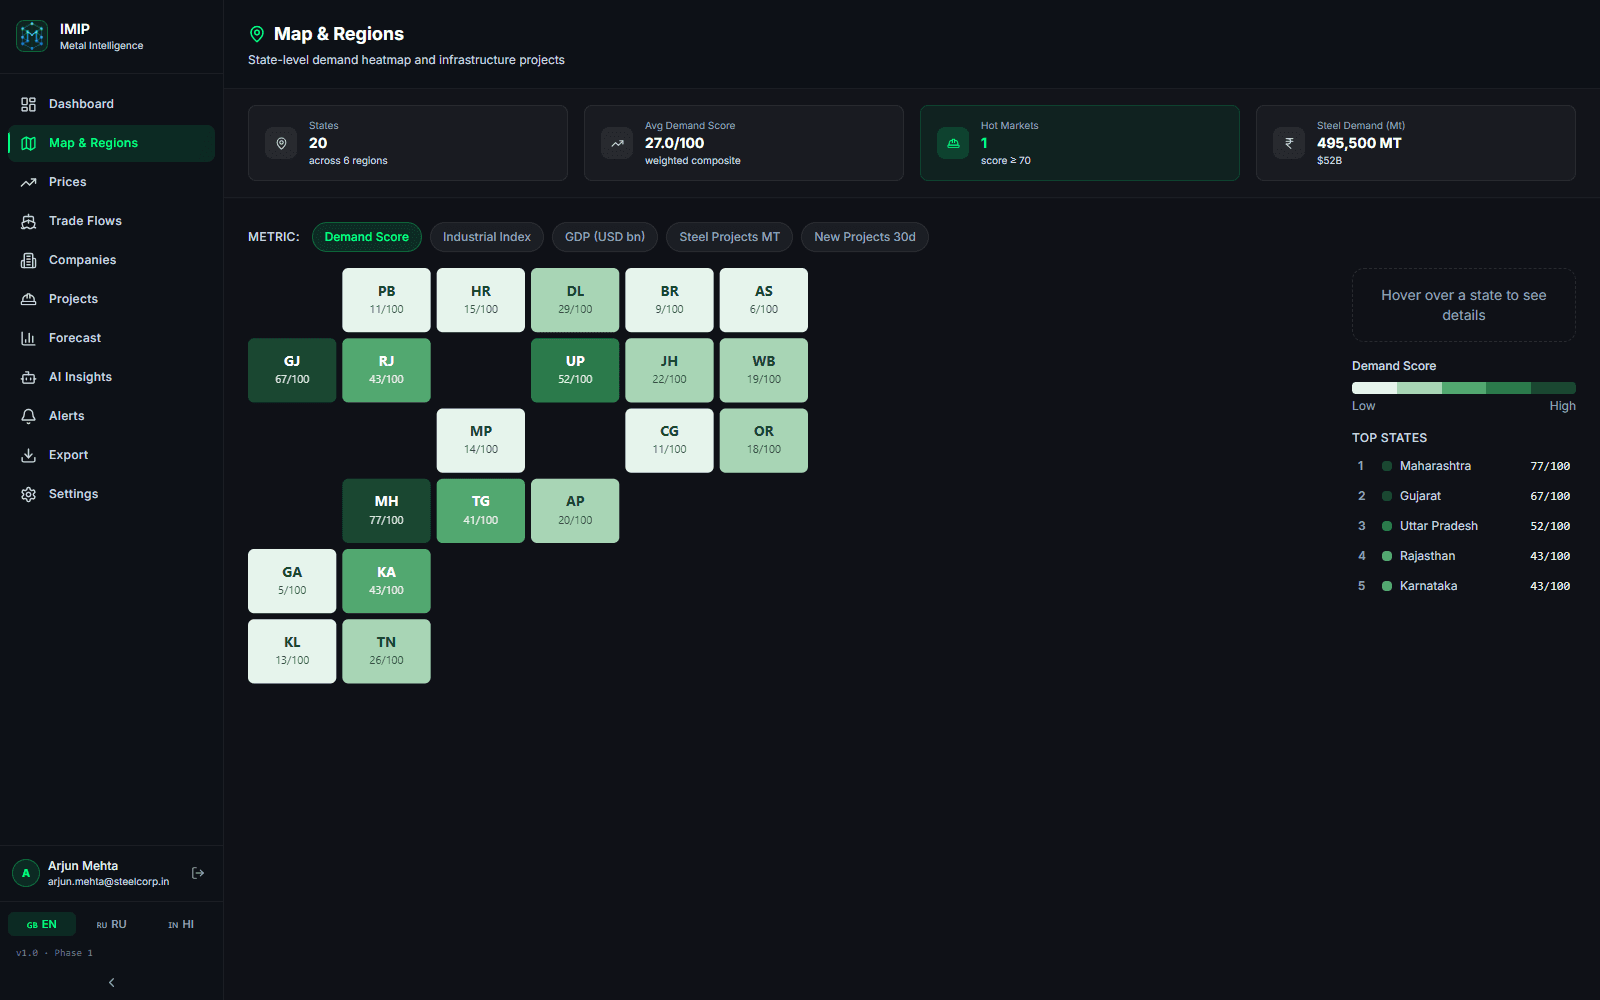
Map
See where steel demand is building before your competitors arrive
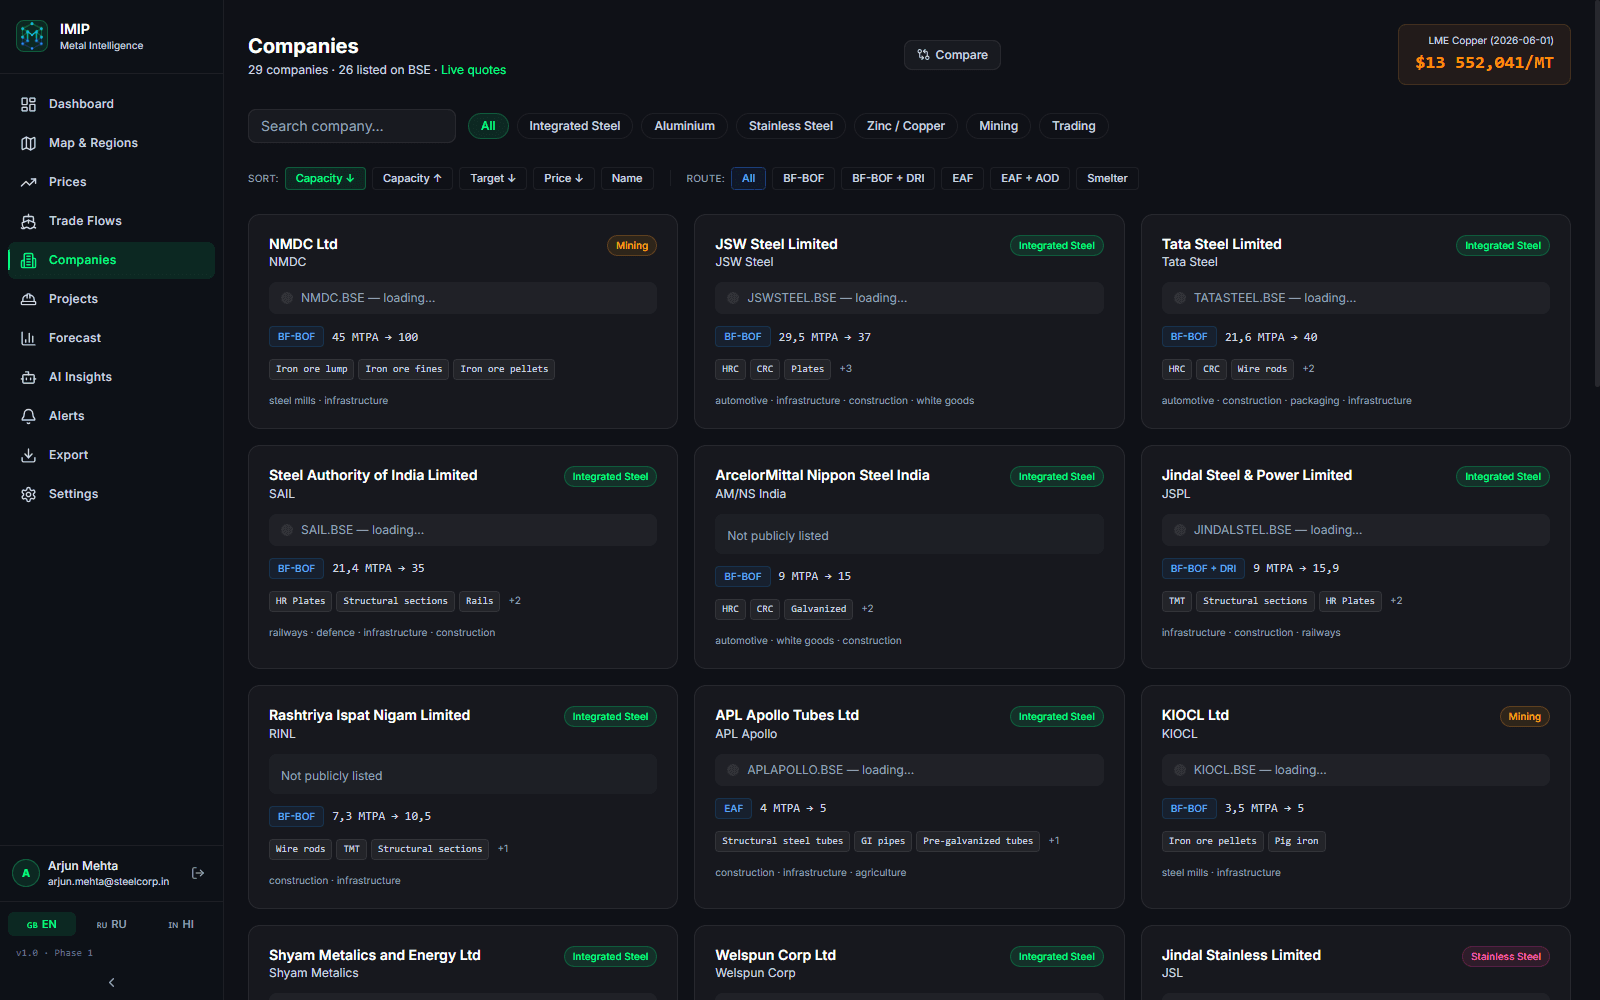
Companies
Compare competitor margins in one click, not 30 rows from Yahoo Finance
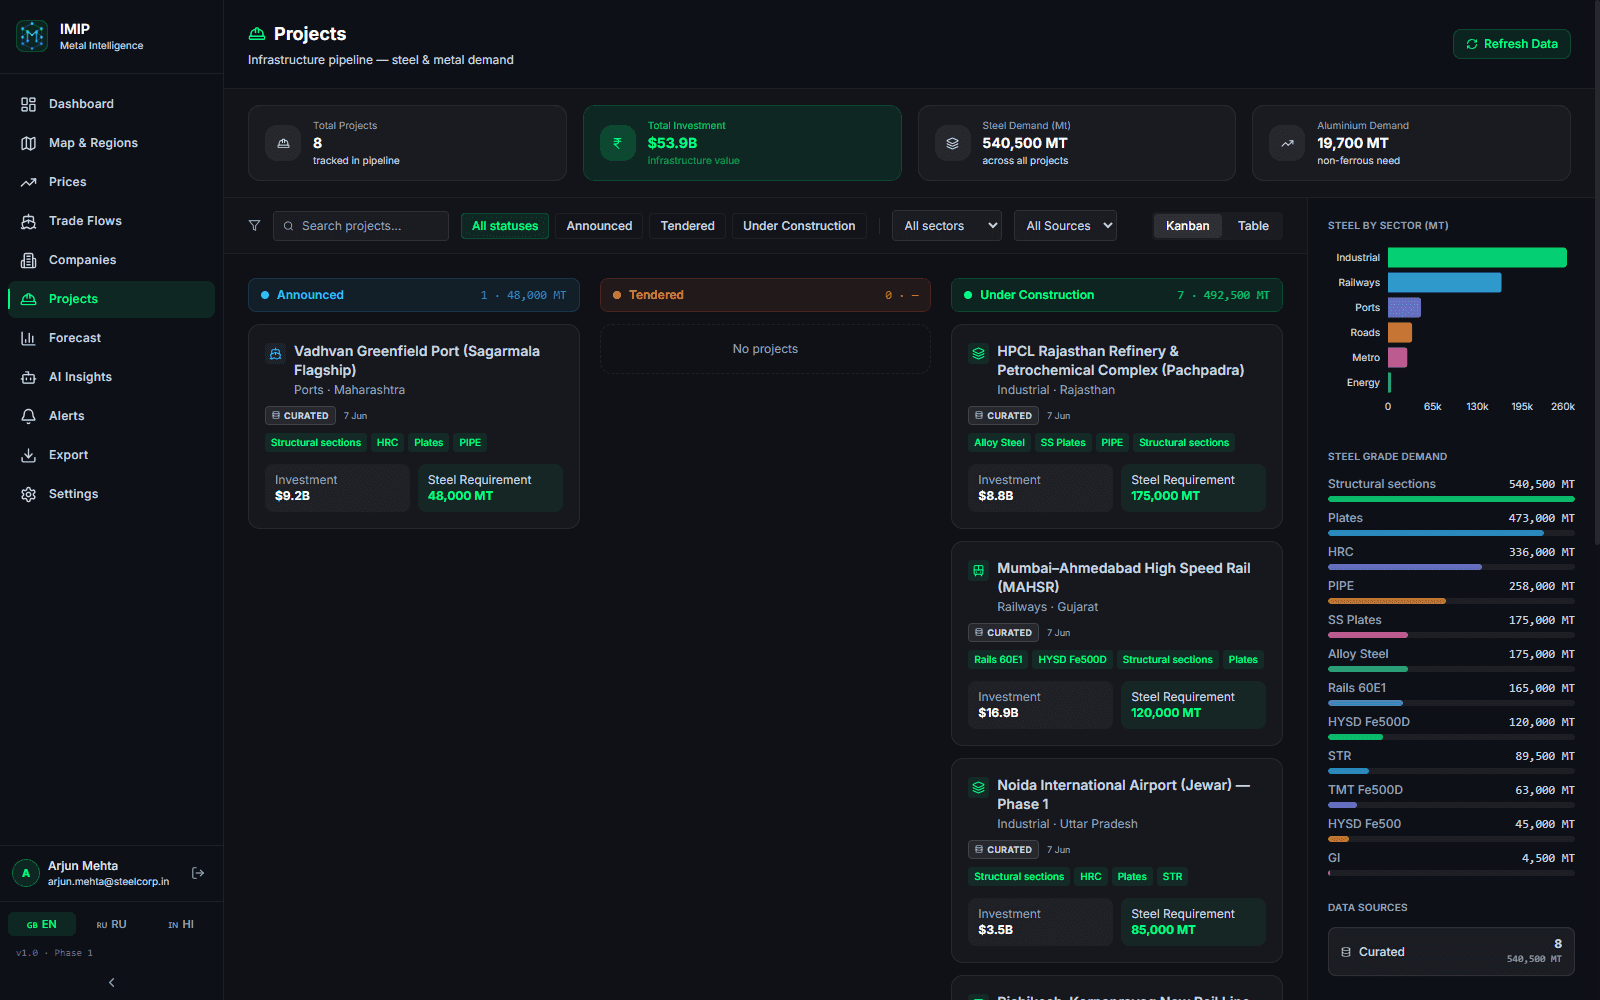
Projects
“Tender → construction” signal 60–90 days before real orders land
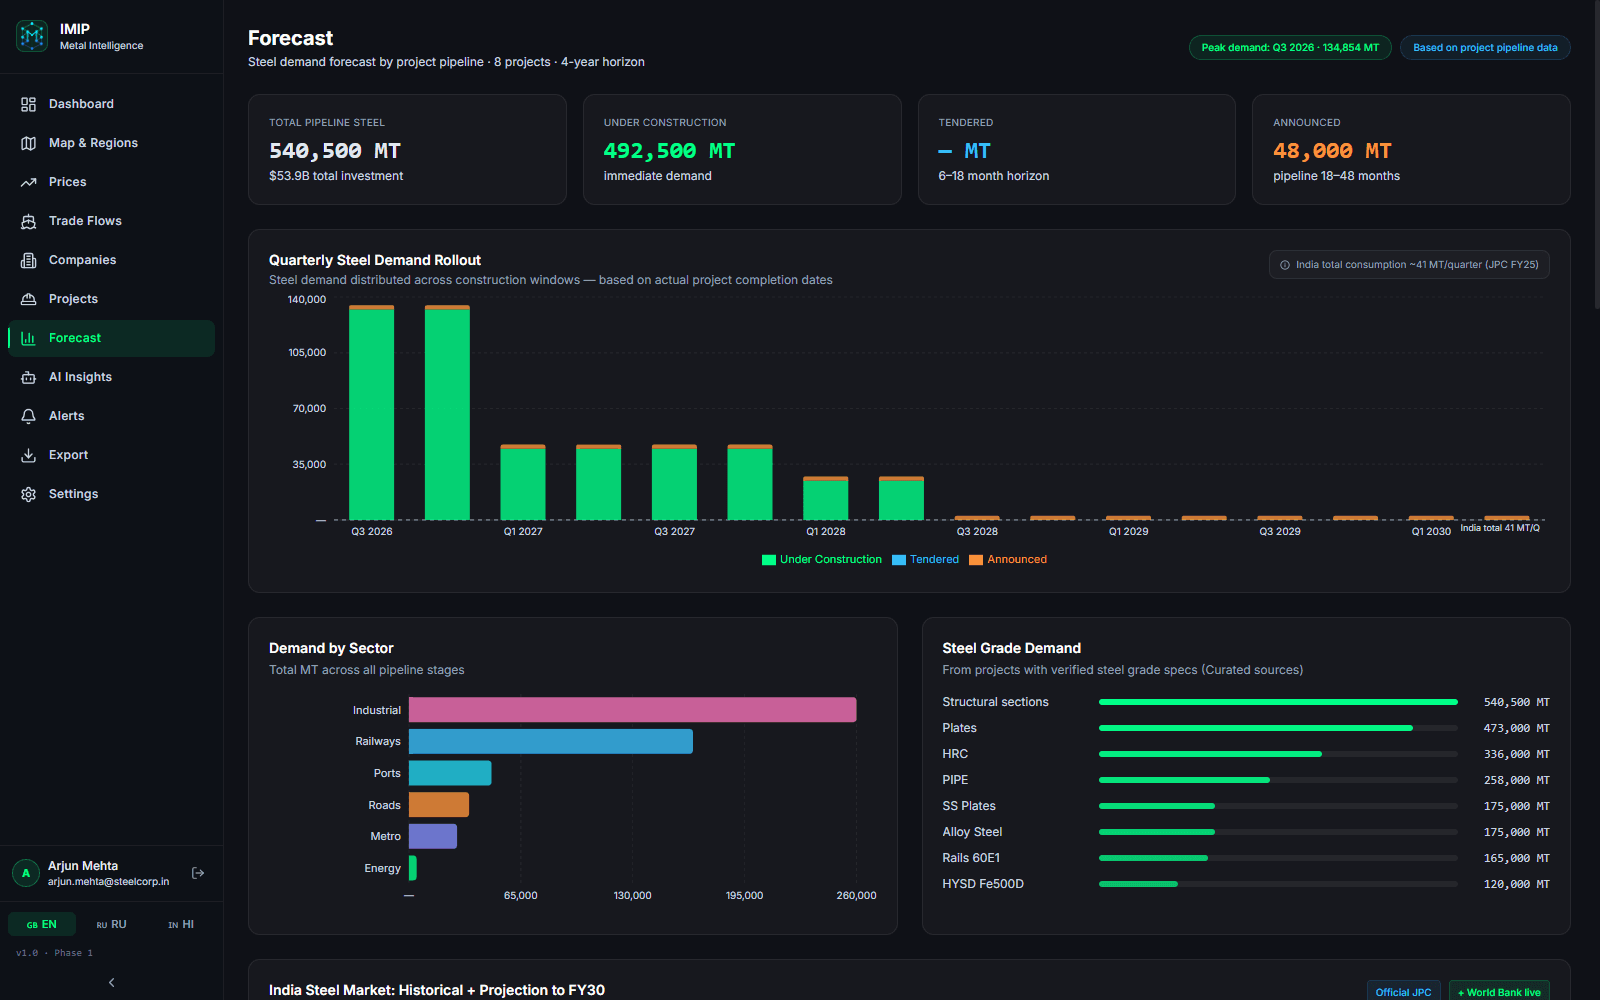
Forecast
Board-level assumptions on official data, not back-of-envelope estimates
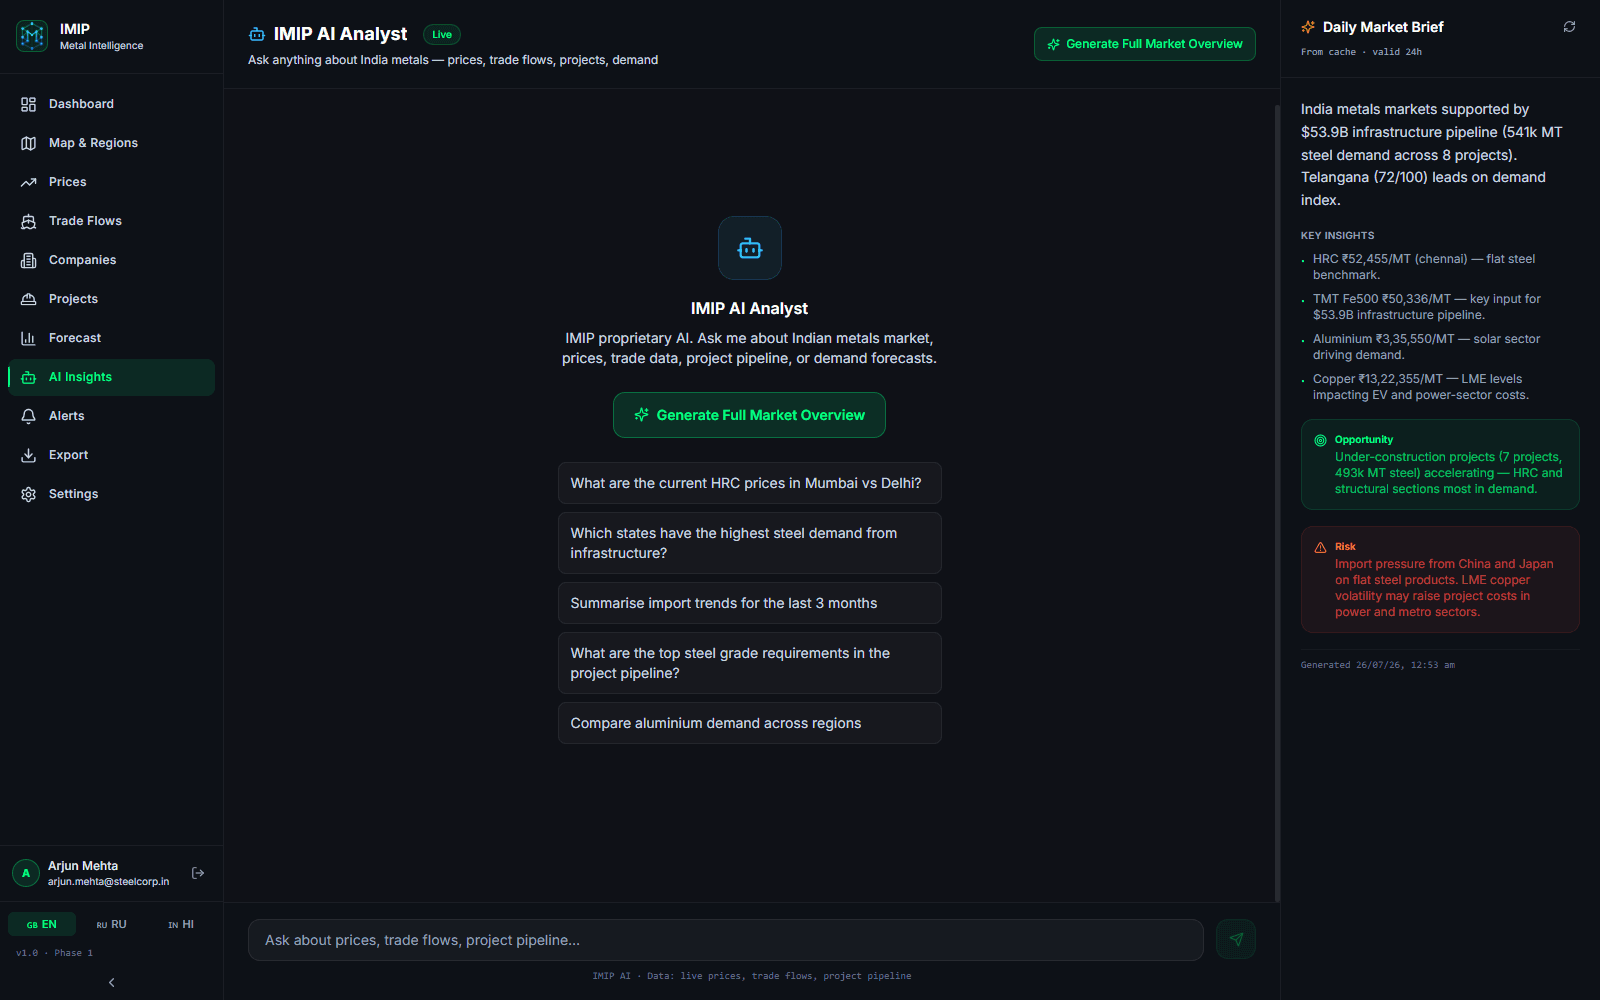
AI Analyst
Ask a market question, get an answer grounded in live data and real-time web search — not a static chatbot
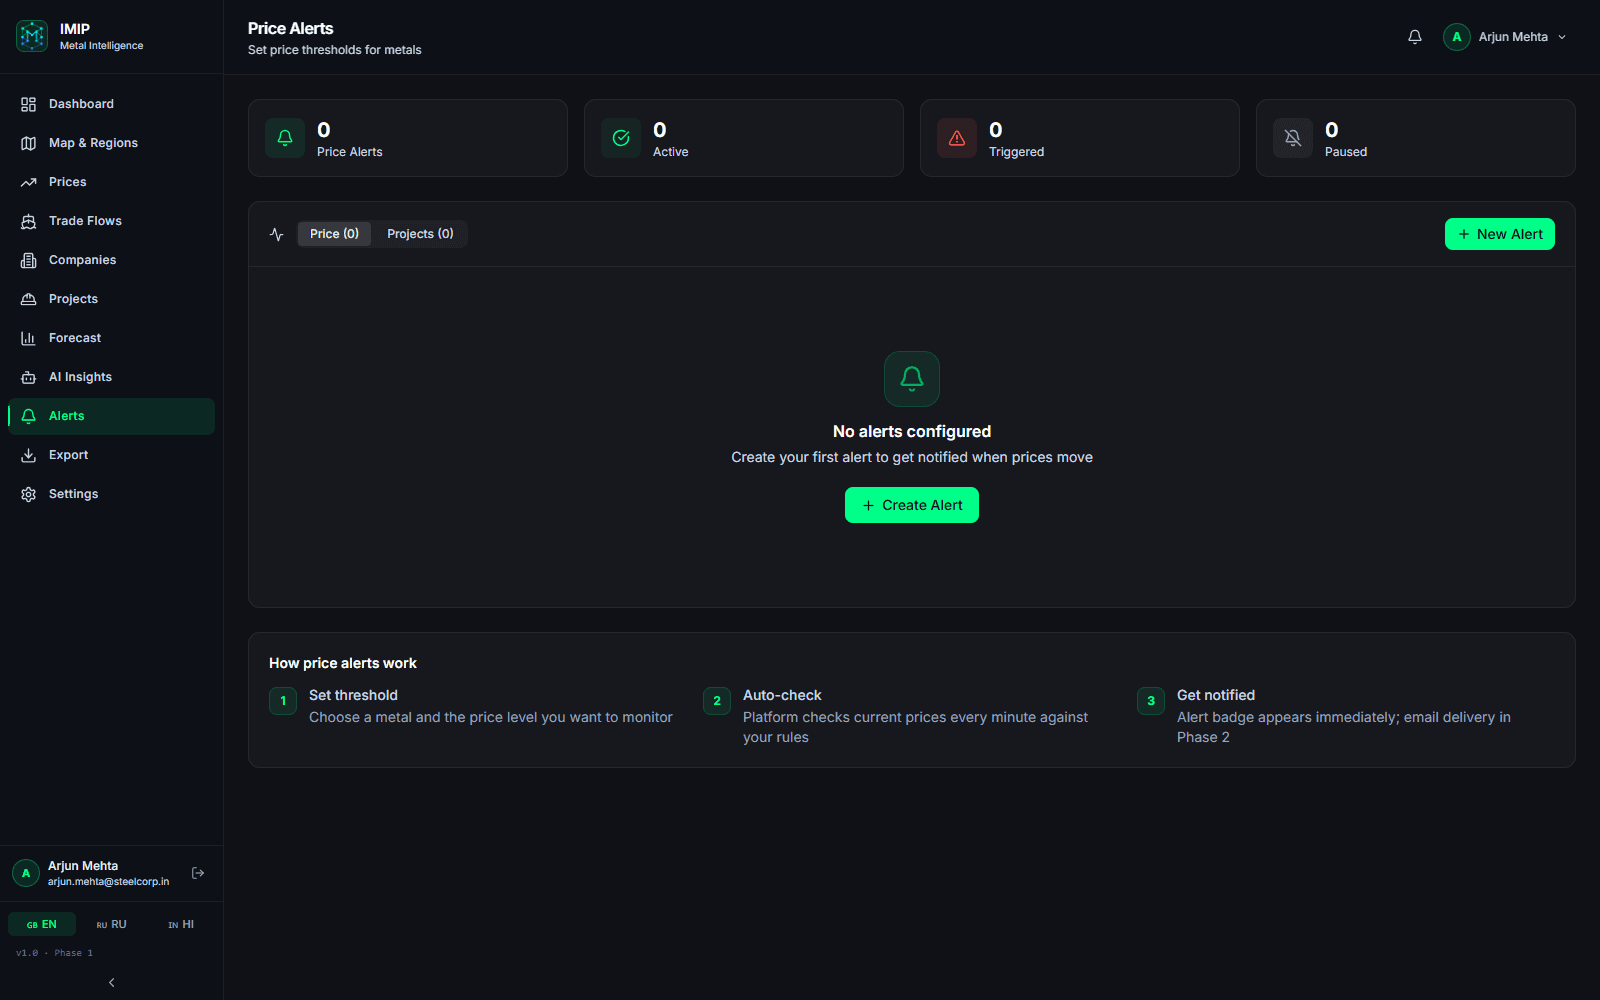
Alerts
Know about a price move or new project before your competitors do

Built Differently. On Purpose.
A proprietary engine, not a raw feed
IMIP draws on real market activity and official Indian government data, then runs both through its own analysis engine — the platform delivers a finished number, not a stack of raw feeds to reconcile.
India steel only
Not a global commodity tool adapted for India. Built exclusively for India's steel and metals market.
Government data, current
Ministry of Steel production figures and IMF macro indicators are pulled in directly — official numbers, sitting in the same dashboard as live market activity.
A margin signal Bloomberg doesn't have
Mill Spread — the margin calculation most teams maintain by hand in Excel — is auto-calculated in real time, every trading day. It isn't available even on $20,000+/seat Bloomberg or Reuters terminals.
Hindi and English, natively
Not a translation layer. Designed for the way Indian steel professionals actually work.
Infrastructure demand on the map
Project pipeline and state-level steel demand in one view. See where orders are forming.
AI on today's live data
Not trained on historical snapshots. Queries the live database. Answers that are current, not textbook.

Time Saved, Calculated
Estimated based on a typical analyst team's workflow at a mid-size Indian steel company, tasks split across whoever owns each one.
per month, for a team of 5 analysts
Redirected from manual data collection to higher-value analysis, advisory, and client work.


See IMIP on Real Steel Market Data
Create a free account and explore the live India steel market dashboard yourself — no credit card, no sales call.
Demo access opens the real dashboard — a few detailed views unlock when you upgrade.